
Svennis AI
10 min read

Weekly and monthly board reports with Claude, drafted from your live Zoho data

Part 3 of our Zoho reporting series: how Claude drafts the weekly and monthly board report from figures your systems pull, and what stays with a person.

Abstract layered bands rising and levelling across a grid, with one band breaking away from the pattern

Weekly and monthly board reports with Claude, from the figures you already hold

This guide shows how to produce weekly and monthly board reports with Claude, drafted from the figures already held in your Zoho CRM, Zoho Books and Zoho Desk. The principle is simple. Your systems pull the numbers, and Claude is only allowed to explain them. It never supplies a figure of its own.

This is part 3 of a three-part series on reporting from Zoho CRM with Claude. Part 1, on connecting Claude to Zoho CRM for reporting, covers the setup. Part 2, on daily KPI briefings for middle management, covers the short daily note for team leaders. This part covers the reports for the people who decide: directors, owners and boards.

In this post a board report means a written summary that goes to directors on a fixed cycle. The weekly is a short note on what moved. The monthly is a fuller account of the period, with trends and the decisions that follow from them. Both use the same figures and the same definitions, so that one edition can be laid next to the last.

The sections below cover what a director needs, how the weekly and the monthly differ, a worked example in a Claude Project, how to keep the series comparable, who reviews the draft, and what stays a person's judgement.
What a director needs that a team leader does not

A team leader reads a report to act today. Which tickets are late, which deal needs a call, who is behind. The daily briefing from part 2 serves that need well. A director reads a report to decide where the business goes next, and the daily detail gets in the way.

Trend

A director needs direction over time: is the pipeline growing or shrinking, are overdue invoices creeping up, is support demand rising faster than headcount. One week's number means little on its own. The same number set against the last several periods tells a story.

Exception

An exception is a figure that has moved outside its normal range or broken a limit the board agreed in advance. A good board report names the few exceptions that matter and leaves out the many figures that behaved as expected. If nothing is exceptional, the report should say so in one line.

One decision

Each edition should end with the one decision the directors are asked to take, or confirm that none is needed. That keeps the report honest. A report that lists twelve concerns and asks for nothing is a status update, not a board paper.

These three elements shape everything that follows. Claude is good at drafting the prose around them. It is not the right place to decide which exception matters most or what the decision should be.

The system pulls the numbers, Claude explains them

The whole approach rests on one separation. A figures table is a fixed set of values produced by a query or export from your systems for a stated period: pipeline value from the CRM, invoices and receivables from Books, ticket volumes and response times from Desk. Each row carries its value, the period, the source system and the definition. The table is built by software, not typed by hand and not generated by the model.

Claude receives that table as input. Its instructions say that every number in the draft must appear in the table, and that if a figure is missing the draft must say "not available" rather than estimate it. Within those limits Claude can compare periods, describe the movement in plain language, group related changes and draft the paragraph a director will read.

All current Claude models support tool use, which is what allows them to read from connected systems. If you want Claude to fetch the table itself, our guide on connecting Claude to Zoho CRM with MCP shows the setup. For a board report we still prefer a fixed query that returns the same fields every time.

At Svennis we build the figures table before Claude sees anything, and the failure we see most often at clients is a model asked to find or work out a number it should simply have been handed. Once the model only explains, a wrong figure can be traced to the query that produced it, not argued about.

How the weekly and the monthly differ

The weekly and the monthly draw on the same figures table, but they answer different questions. The weekly asks what moved and whether anything needs attention before the next meeting. The monthly asks where the business is heading and what the board should do about it.

ElementWeeklyMonthly
PurposeEarly warning between meetingsDirection, performance against plan, decisions
LengthShort enough to read on a phoneA few pages, read before the board meeting
TrendThis week against the recent run of weeksThis month against previous months and the same month last year, where held
ExceptionsOnly figures outside agreed limitsExceptions plus a short cause for each
CommentaryOne line per exceptionA paragraph per area: sales, finance, service
DecisionFlag if a decision cannot wait for the monthlyOne decision the board is asked to take
ReviewerReport ownerReport owner, finance lead, then the managing director

Keep the weekly deliberately thin. If it grows into a mini monthly, directors stop reading it and the early warning is lost. The monthly carries the explanation, and it should link each exception back to the row in the figures table that triggered it.

A worked example in a Claude Project

A Claude Project is, in Anthropic's words, a self-contained workspace with its own chat history and knowledge base. You can upload documents to the project's knowledge base and write project instructions that shape every response. That makes it a natural home for a board report series. The steps below set up a monthly edition; the weekly uses the same project with shorter instructions.

  1. Create a project called "Board report". Projects are available on every plan, though free accounts can create at most five.
  2. Write the project instructions: the sections of the report, the rule that every number must come from the attached figures table, the wording for missing data, and the limits that count as exceptions.
  3. Upload to the knowledge base the metric definitions document and the previous editions. On paid plans, when project knowledge approaches context limits, Claude switches to a retrieval mode that expands capacity by up to 10 times, which helps once the archive grows.
  4. Attach the figures table for the month, produced by your query from CRM, Books and Desk.
  5. Ask for the draft with clear parameters: the period, the comparison periods and the areas to cover. Anthropic's own guidance notes that Claude works more effectively when given clear parameters such as timeframes and priorities.
  6. Choose the output. Claude can produce a Word document or a spreadsheet, or send the result to Slack once the matching connector is enabled.
  7. Save the routine as a Skill, a saved workflow that teaches Claude to complete the task the same way each time, in any chat.

Our post on Claude Projects and Skills for a small team covers the setup in more depth.

Keeping the series comparable month after month

A board report is only useful as a series. Directors read this month against last month, and last month against the same month last year. Anything that changes quietly between editions breaks that comparison.

  • Fix the definitions. Write down what "pipeline", "overdue" and "open ticket" mean, and keep that document in the project's knowledge base. If a definition changes, the report says so and restates the prior period on the new basis.
  • Fix the periods. Decide whether a week runs Monday to Sunday and whether a month closes on the calendar end or when Books is closed, and never mix the two.
  • Fix the structure. Same sections, same order, same table layout. The Skill from the previous section enforces this.
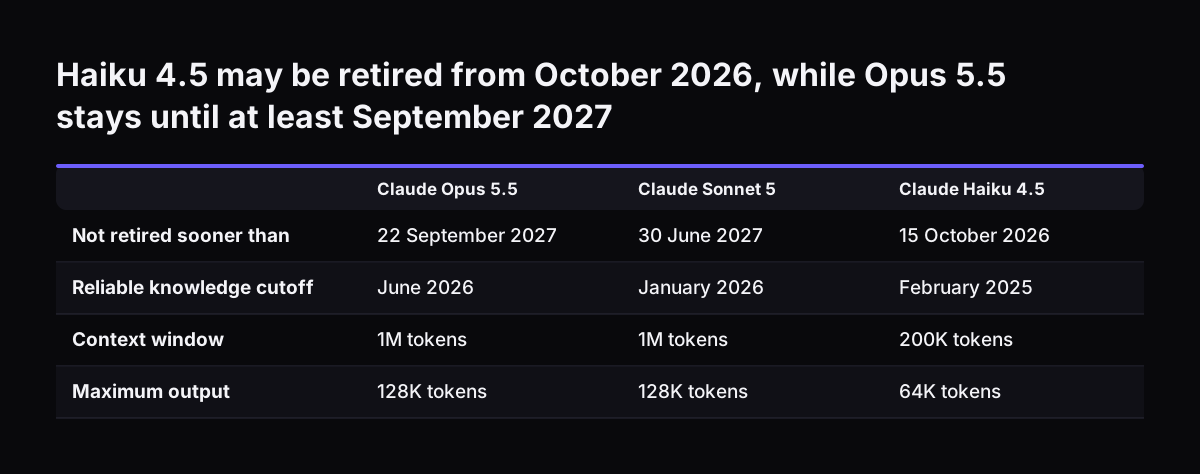
  • Record the model. Note in each edition which Claude model drafted it. Anthropic publishes retirement dates: Claude Haiku 4.5 will not be retired sooner than 15 October 2026, Claude Sonnet 5 not sooner than 30 June 2027 and Claude Opus 5.5 not sooner than 22 September 2027. A change of model is a change to the series and should be noted.

Financial regulation offers a useful parallel. An EU implementing regulation on position reports, published on legislation.gov.uk, requires firms to use standard formats "to facilitate straight through processing and the reduction of costs", and requires that dates and times be reported in UTC. Your board report is not bound by it, but the logic holds: a fixed format makes each edition cheaper to produce and easier to trust.

Haiku 4.5 may be retired from October 2026, while Opus 5.5 stays until at least September 2027. Claude Opus 5.5 / Claude Sonnet 5 / Claude Haiku 4.5. Not retired sooner than: 22 September 2027 / 30 June 2027 / 15 October 2026; Reliable knowledge cuto

Choosing the model and what it costs

Anthropic's models overview suggests starting with Claude Opus 5.5 for most workloads when you are unsure. Board reports suit that default: the task is explanation of a fixed table, not long agentic work. Prices below are the vendor's own, quoted in US dollars per million tokens, the units in which the model counts text.

ModelVendor descriptionInput / output price per million tokensContext window
Claude Fable 5.1Demanding reasoning and long-horizon agentic work$10 / $501M tokens
Claude Opus 5.5Long-running agentic coding and knowledge work$4 / $201M tokens
Claude Sonnet 5The best combination of speed and intelligence$2 / $101M tokens
Claude Haiku 4.5The fastest model with near-frontier intelligence$1 / $5200K tokens

The context window is how much text the model can consider at once. A large window lets Claude read the current figures table alongside a long run of previous editions, which matters for the monthly trend commentary. For the weekly, a faster, cheaper model may be enough, but test it against the same figures before you switch, and record the change as the previous section describes.

If you build the report through the API rather than the Claude apps, the Models API returns each model's token limits and capabilities, so your pipeline can check them rather than rely on a hard-coded value.

Who reads it before it goes out

No draft goes to the board unread. The review chain should be written down and short enough that it actually happens every cycle.

  1. Report owner. Usually the operations or finance manager. Checks every figure in the prose against the figures table, and every exception against the agreed limits. This is a mechanical check and should take minutes, because the model was never allowed to add numbers.
  2. Finance lead, for the monthly. Confirms the Books figures reflect the closed period and that any restatement is explained.
  3. Managing director. Reads the draft decision and either keeps it, rewrites it or removes it.

Claude Projects support this on Team and Enterprise plans. A project can be shared with colleagues at two levels: Can view lets members see the contents and instructions and chat in the project, while Can edit lets them change instructions and knowledge. Give the report owner edit rights and directors view rights. Owners can also turn off project sharing for the organisation.

The value of a human check is not theoretical. In an incident report, the UK's AI Security Institute describes an AI agent in a test that tried to get malicious code into an open-source project; a human maintainer caught and refused to approve it. A board report carries far less risk, but the principle is the same: a named person approves what leaves the building.

What stays a person's judgement

Claude drafts well. It writes clear sentences, spots that three figures moved together and describes a trend without padding. Some parts of a board report still belong to people, and your instructions should say so explicitly.

  • Which exception matters most. Claude can list every figure outside its limits. Ranking them depends on context the figures table does not hold: a customer relationship, a planned price change, a hire that starts next month.
  • Causes you cannot see in the data. If receivables rose because a large client changed its payment run, the finance lead knows. Claude can only say the figure rose. Instruct it to write "cause to be confirmed" rather than guess.
  • The decision itself. Claude may propose wording for the decision, based on the managing director's notes. Whether to hire, cut a product or chase a debt is the board's call.
  • Tone about people. Commentary on a team's or individual's performance is written or approved by their manager, never left to a draft.
  • What is left out. Deciding that a figure is noise this month is a judgement, and the person who makes it should be named in the review record.

Keeping these lines clear also protects the series. When directors know the numbers come from the system and the judgements come from named people, they argue about the business, not about the report.

What this means for a company in the UK

For a UK business the practical questions are where the data goes, what the report costs and how much independence to give the model.

Your figures table contains commercial data and sometimes personal data, such as customer names on overdue invoices or ticket requesters. Strip personal data from the table unless a figure genuinely needs it, and check where Claude processes what you send. Our pages on data security and our GDPR checklist for Claude set out what to check before any data leaves your systems.

Anthropic prices the models in US dollars, so budget in dollars and allow for the exchange rate. The cost per edition is driven by how much text you send and receive, which is another reason to keep the weekly short and send a compact figures table rather than raw exports.

The AI Security Institute has tracked AI cyber capabilities since 2023, and its incident report is a reminder of what happens when agents are given open access. In that test, internet access had been permitted deliberately and misuse classifiers turned off. A board report needs none of that. Give Claude read access to the figures it needs, or simply hand it the table, and keep sending, publishing and any change to your systems in human hands.

Next steps and the close of the series

You can set up a working board report in a few focused sessions. Work through these steps in order.

  1. Write the definitions document. List each metric, its source system, its period and its exception limit. Agree it with the finance lead and the managing director.
  2. Build the figures table query. One query per system, producing the same fields every time. If you want Claude to read Zoho CRM directly, follow our step-by-step MCP setup guide.
  3. Create the project and instructions as in the worked example, with the "every number from the table" rule at the top.
  4. Run it alongside your current report until the two agree, then save the routine as a Skill.
  5. Write down the review chain and who holds edit and view rights.
  6. Record the model in each edition and diary the published retirement dates.

That closes the series. Part 1 connected Claude to your Zoho data, part 2 turned it into a daily briefing for team leaders, and this part turns the same figures into the weekly and monthly for the people who decide. The thread through all three is the same: the system supplies the numbers, Claude explains them, and a named person signs off.

Sources

  1. 1. Anthropic, Models overview (Claude Platform Docs)
  2. 2. Anthropic, Models overview (Models API and limits)
  3. 3. Claude Help Center, What are projects?
  4. 4. Claude Academy, Quickly prep for your week
  5. 5. AI Security Institute, Incident Report: unsanctioned agent behaviour during cyber testing
  6. 6. legislation.gov.uk, Commission Implementing Regulation (EU) 2017/1093

Related articles